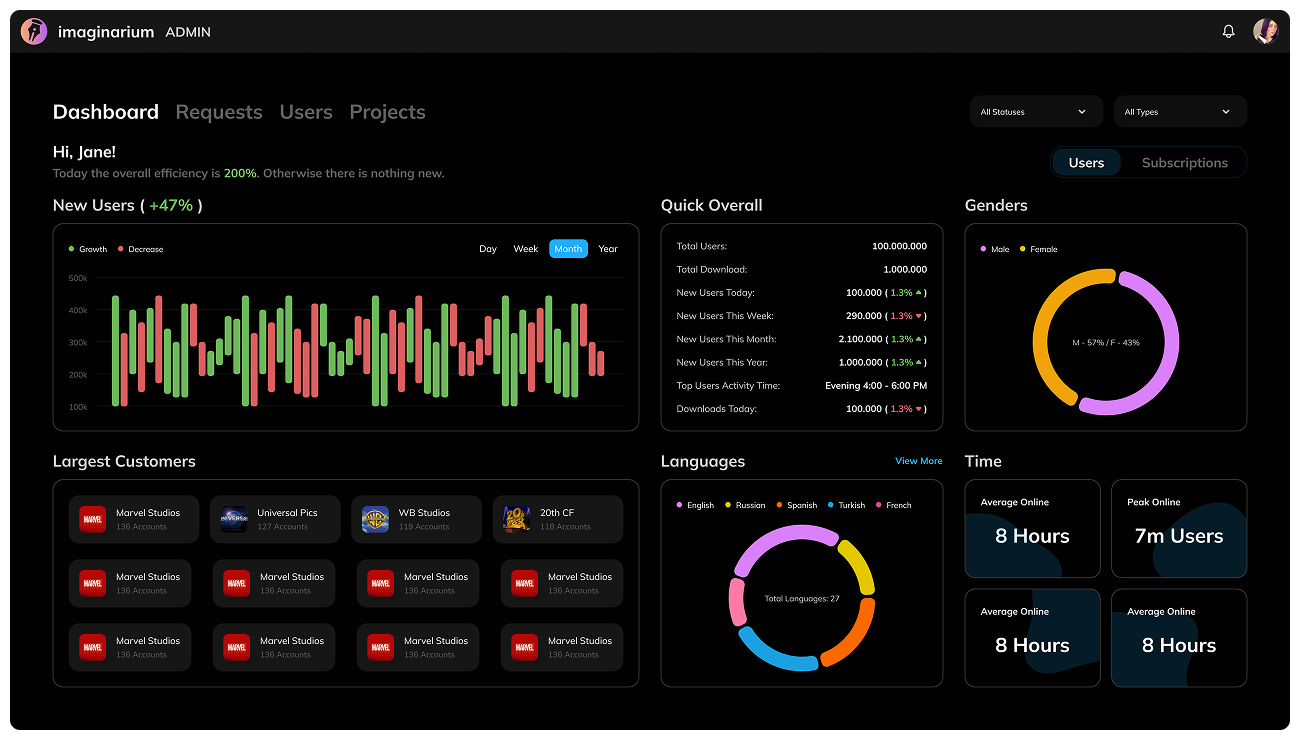
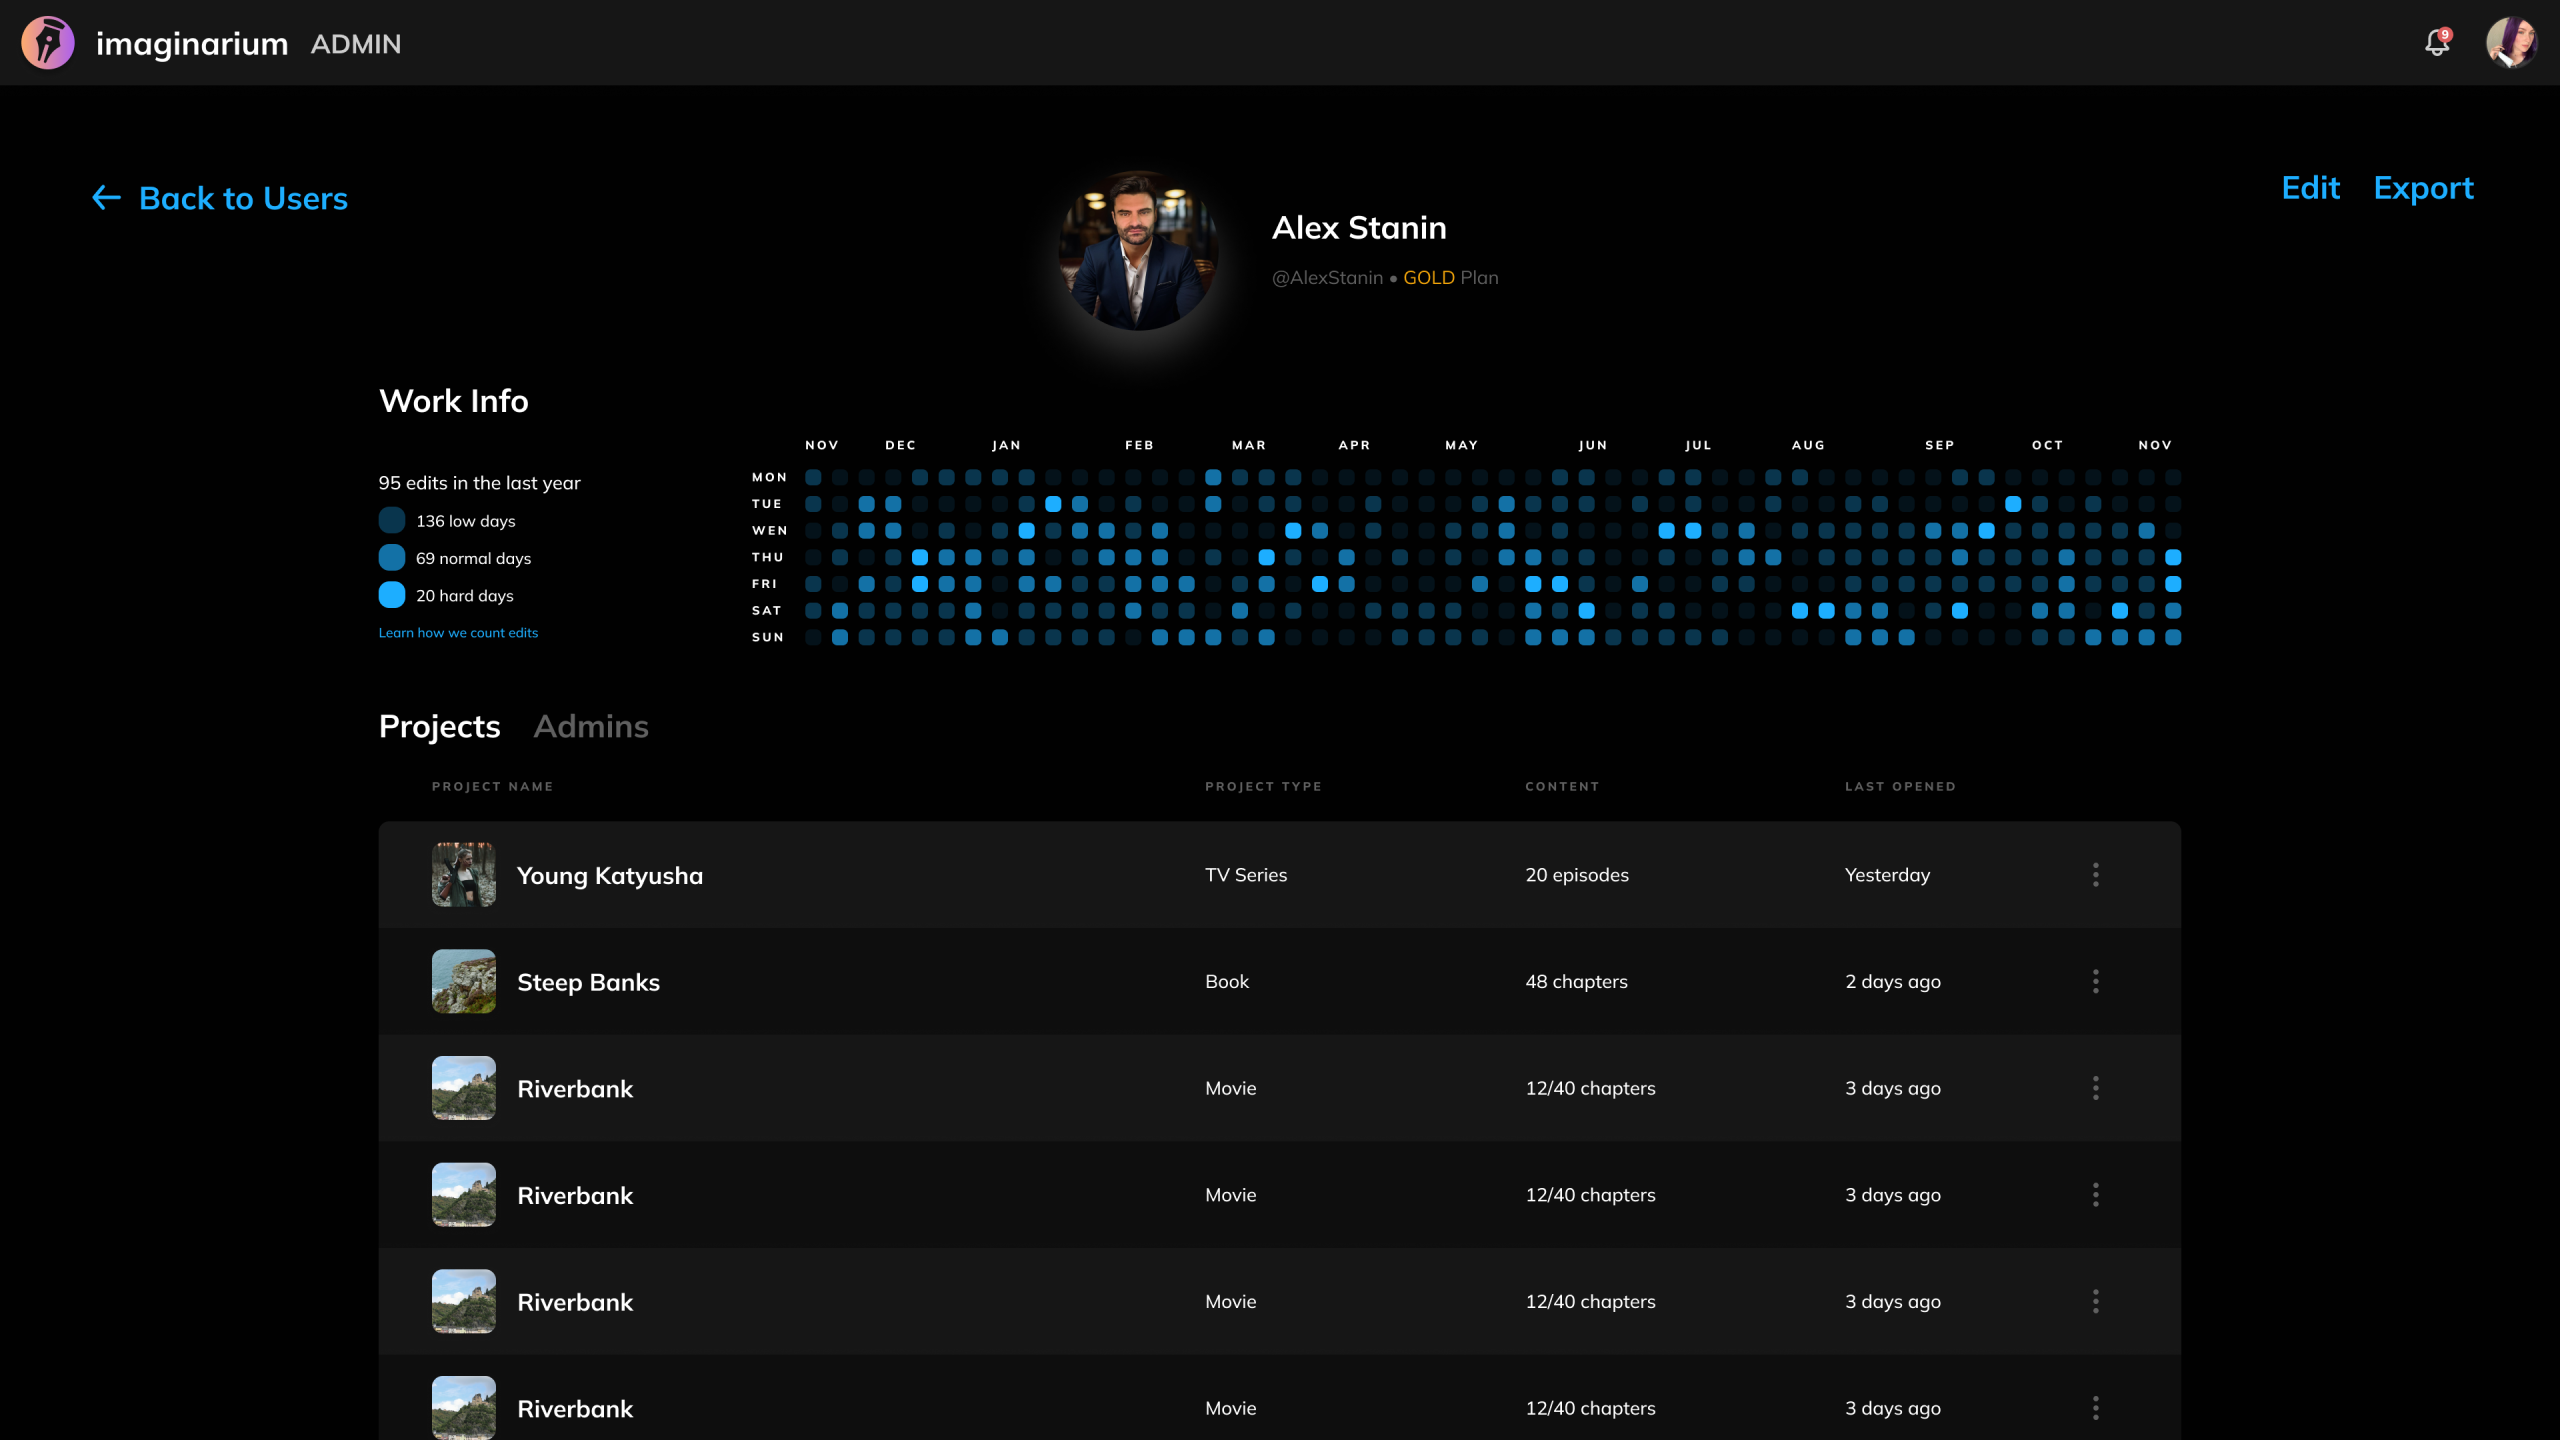
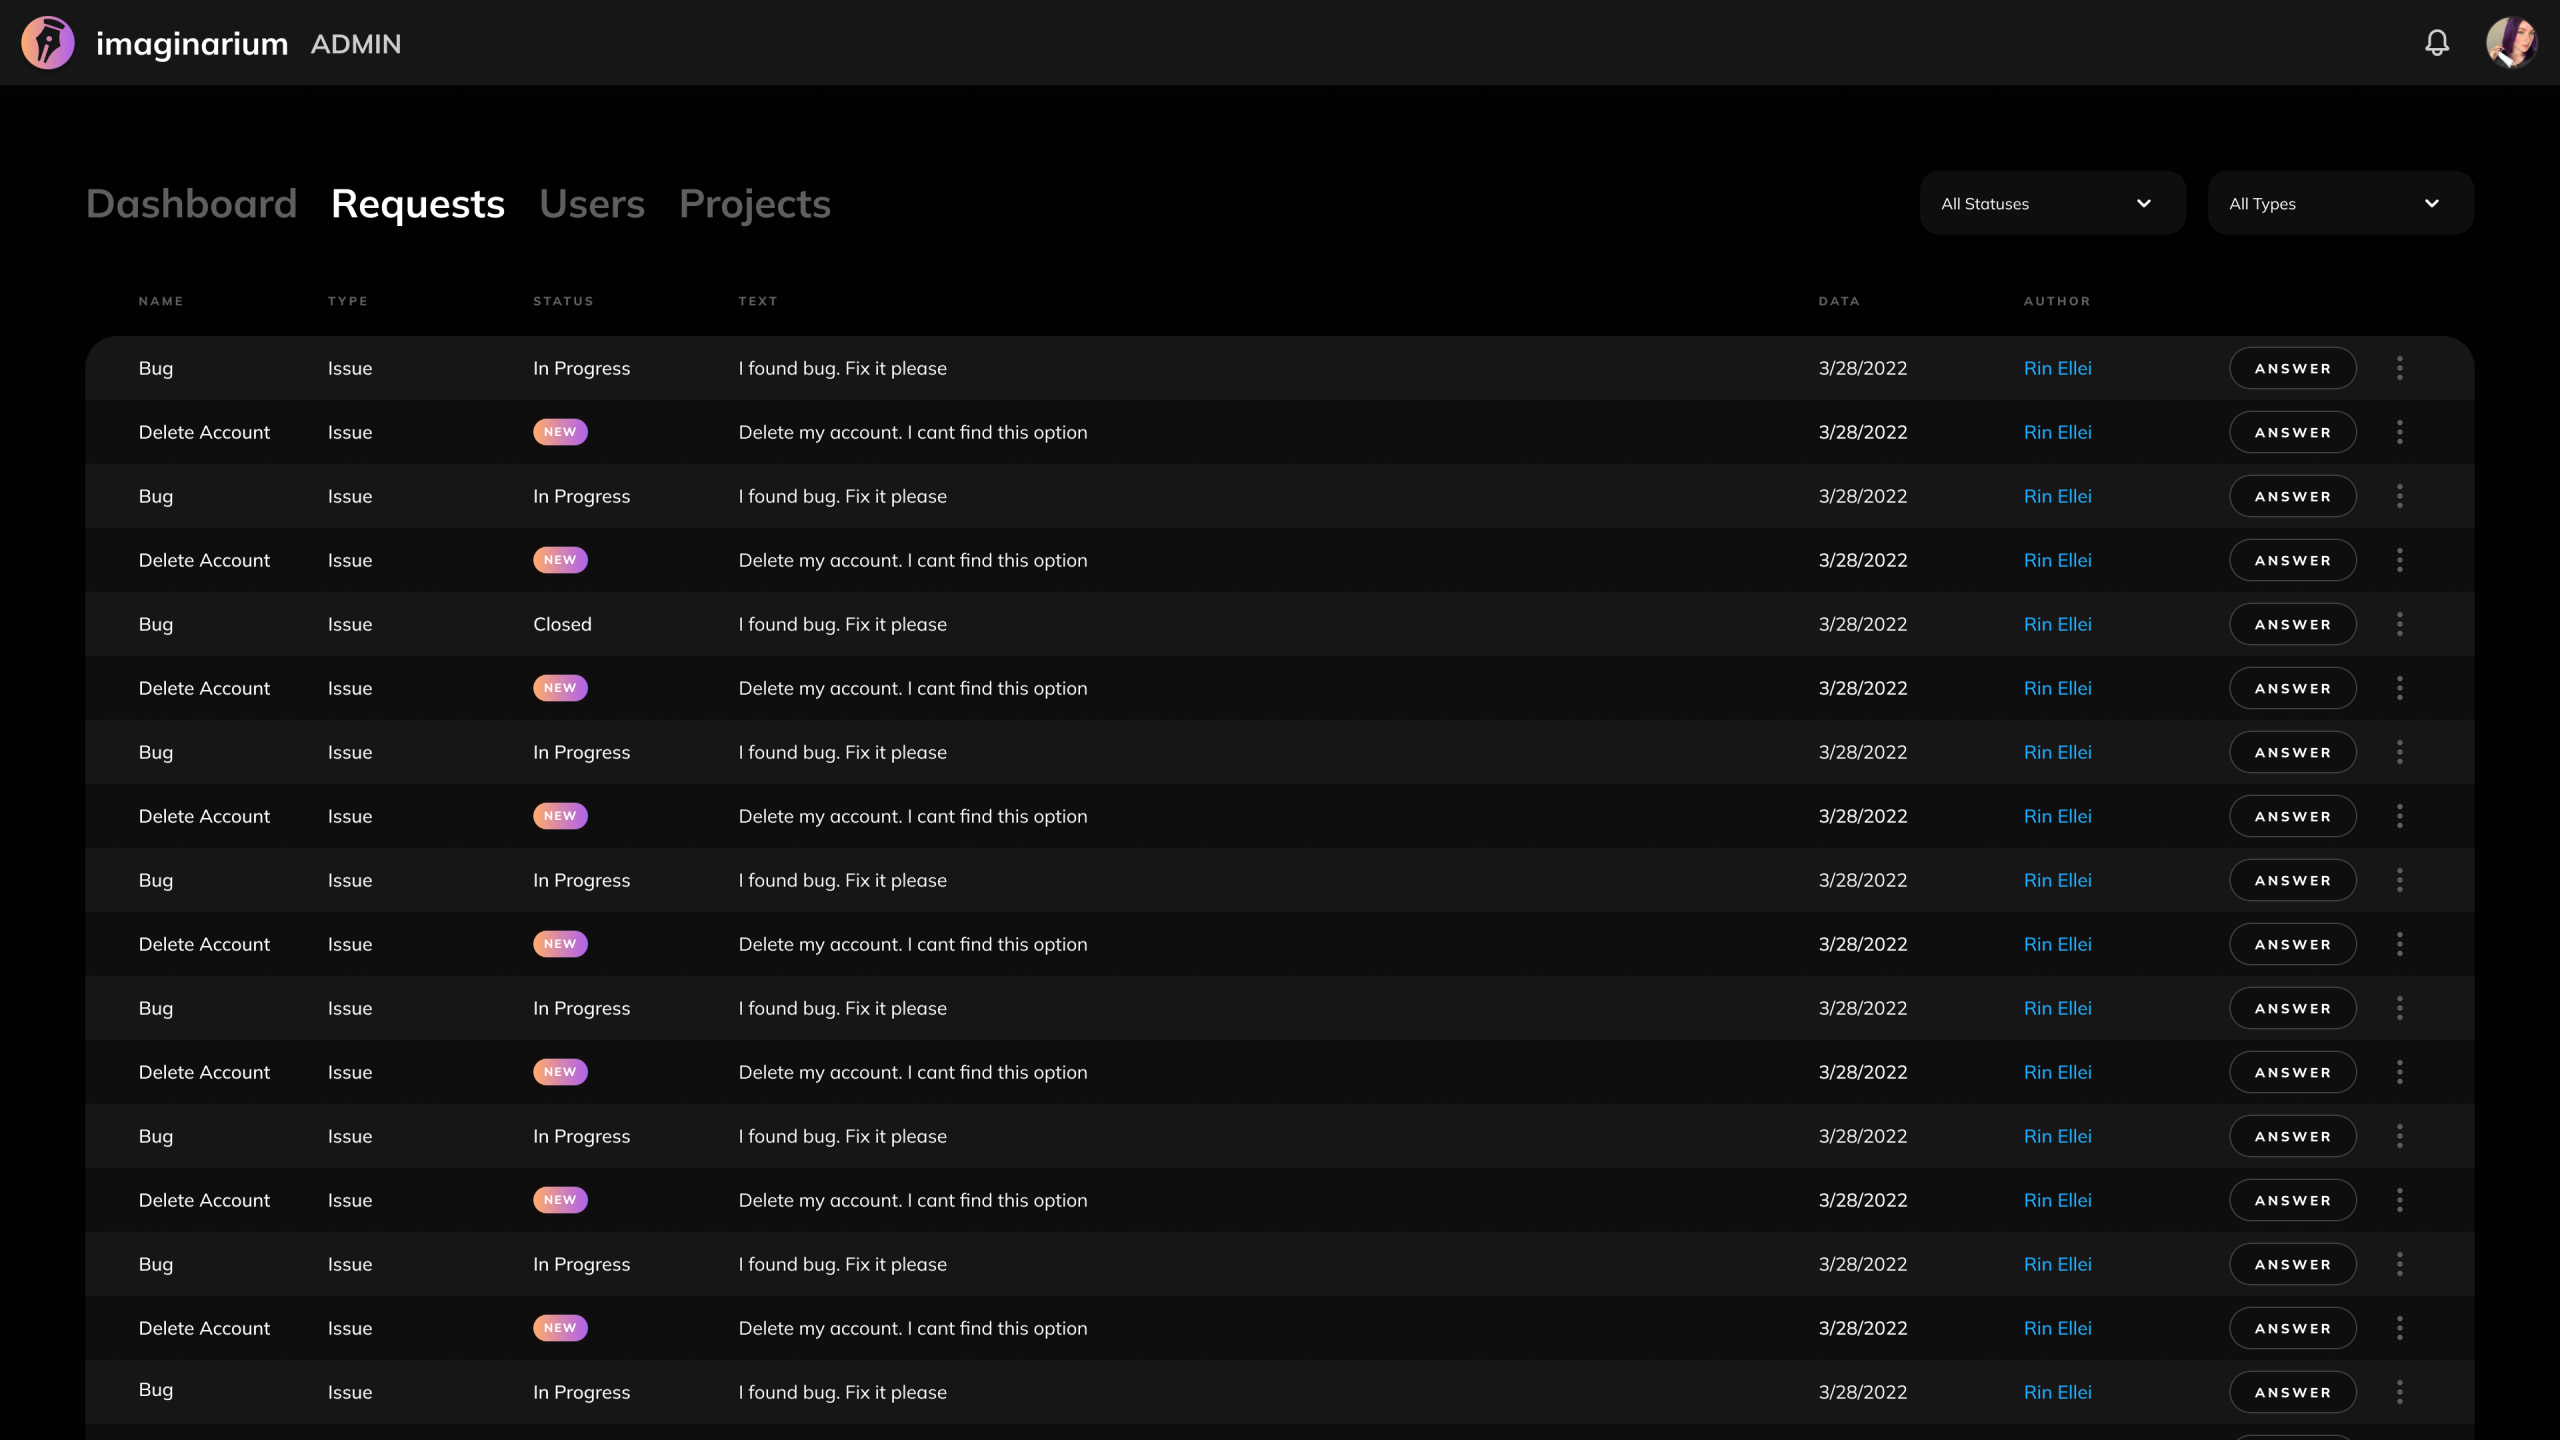
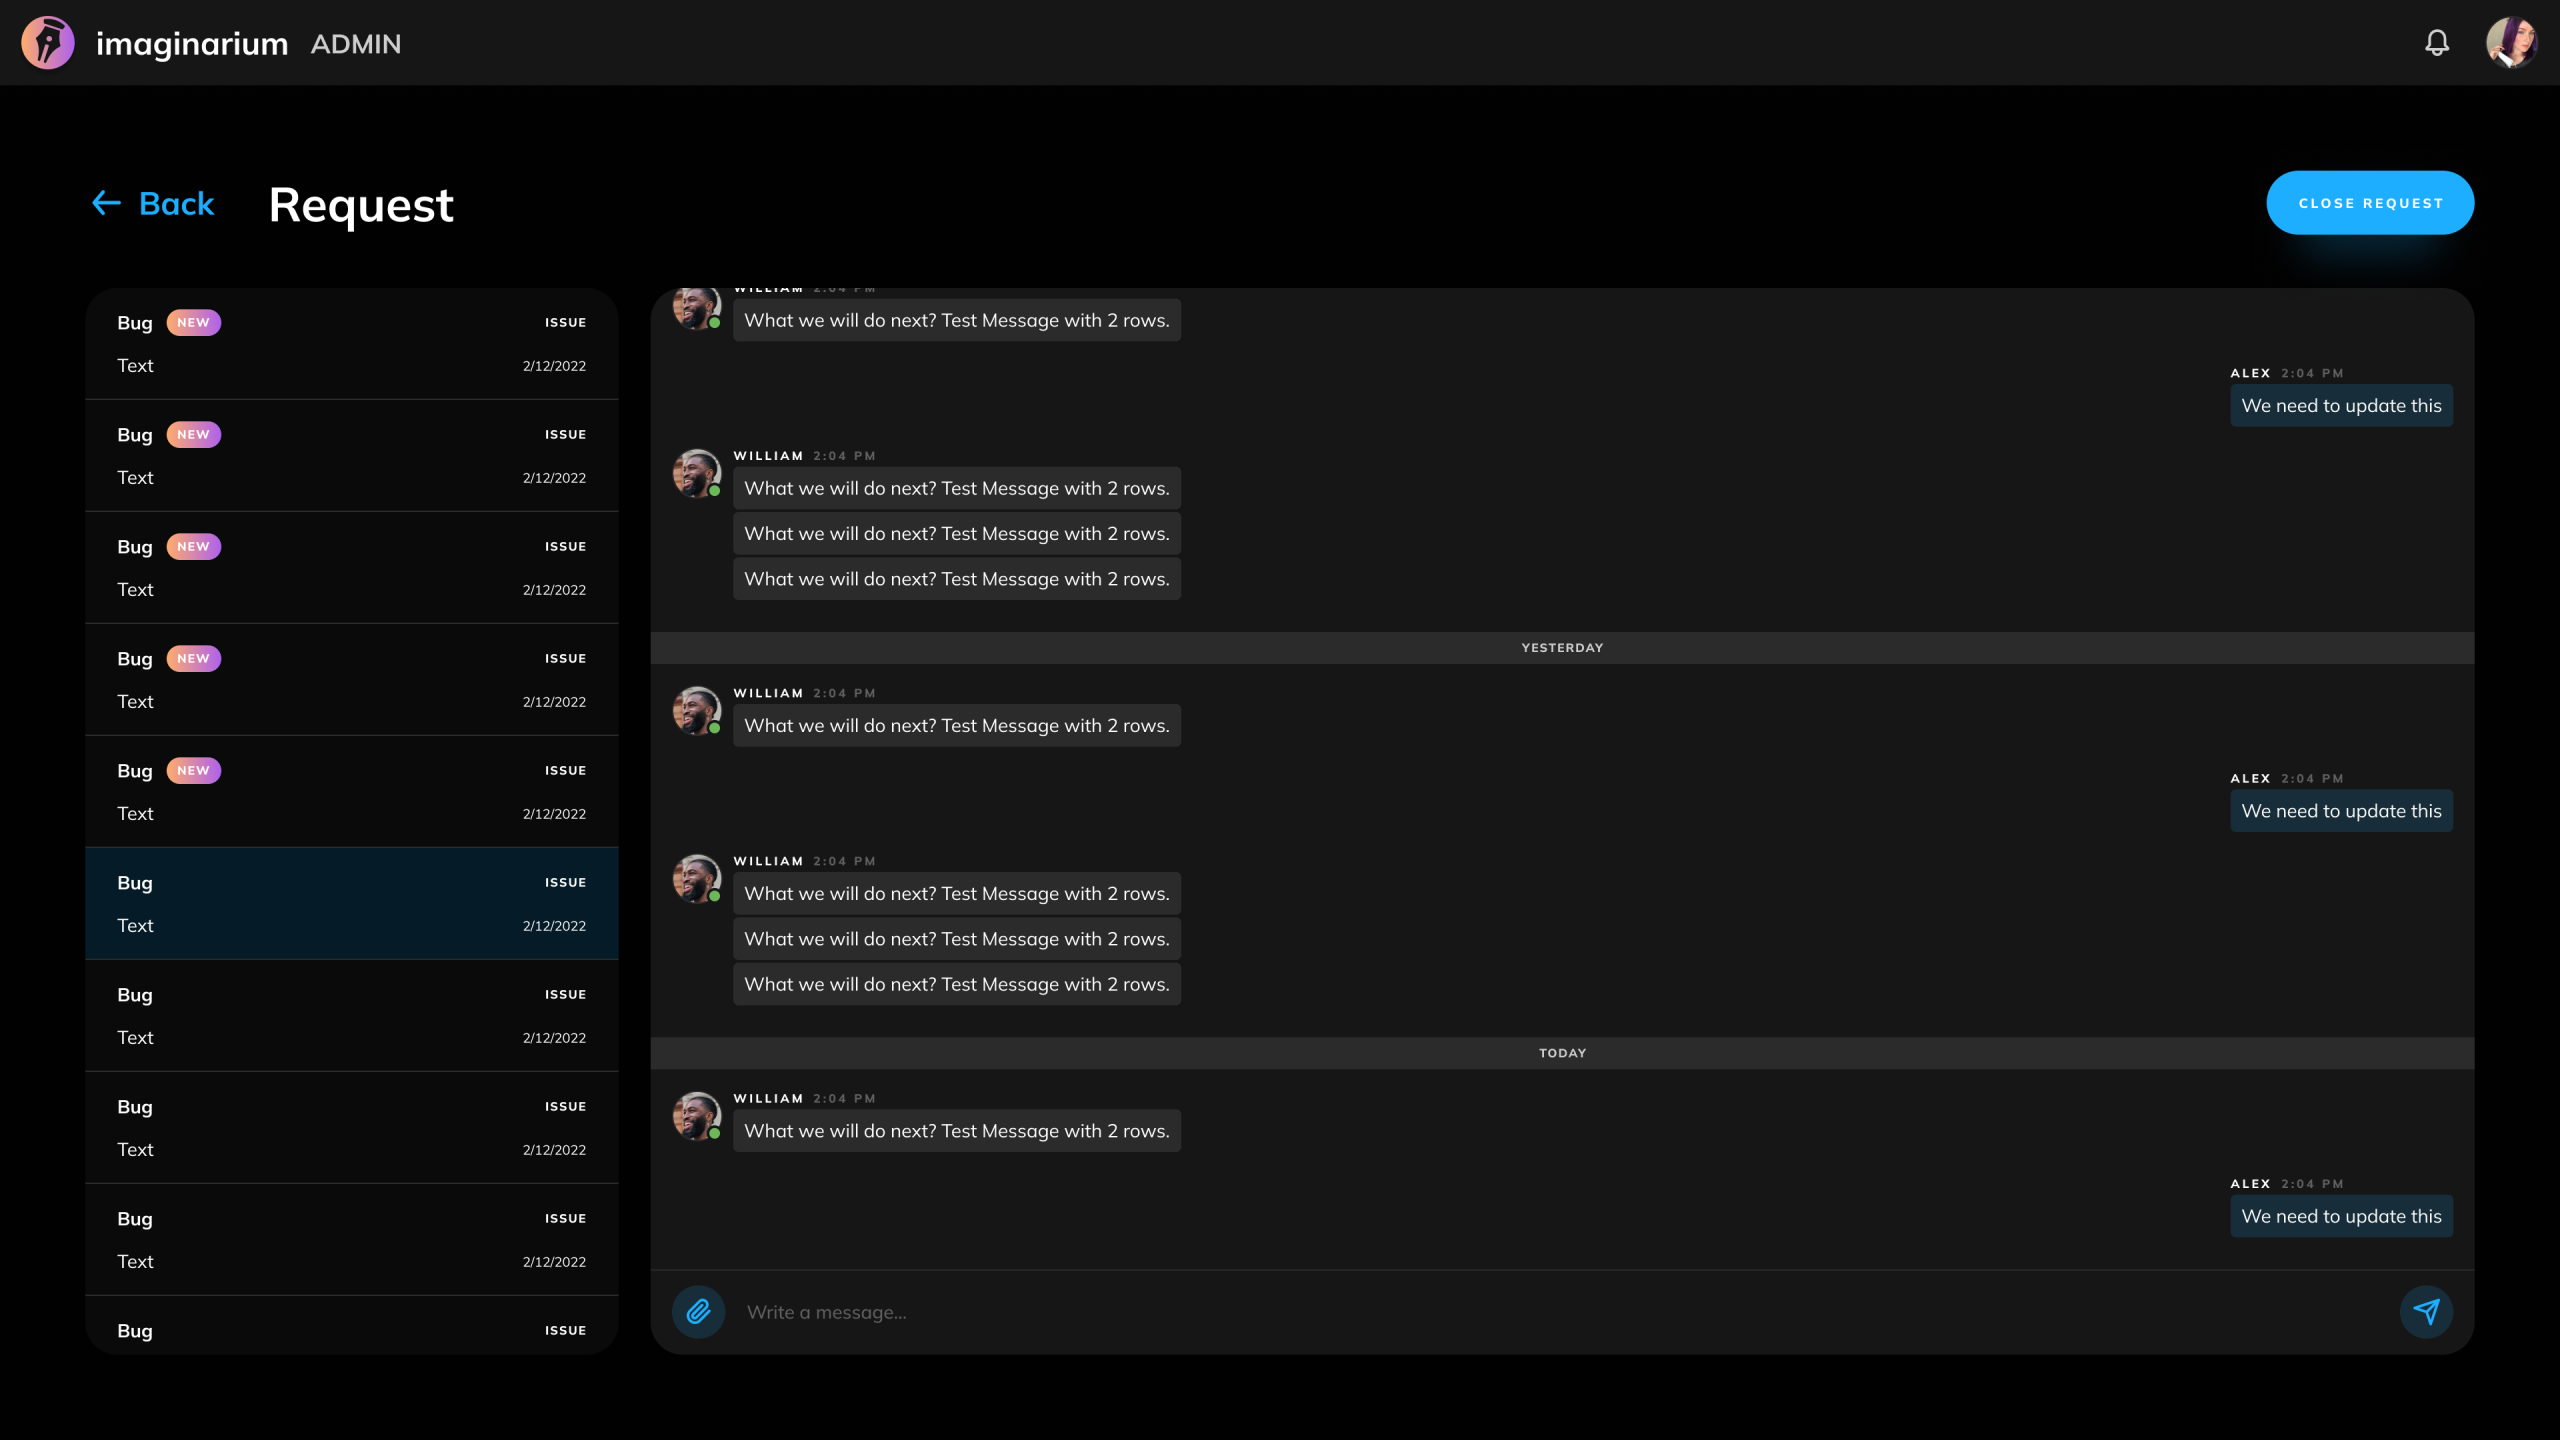
Copyright © 2025 All rights reserved. Built with love in Texas.
Product Web App
About a Project This project focused on building a separate internal application for the Imaginarium platform—the Admin Dashboard. This tool was created for internal stakeholders (e.g., operations, marketing, product leadership, and support teams) to manage user accounts, analyze platform activity, and monitor high-level business metrics. While Imaginarium’s main app serves creative users, this dashboard was […]
This project focused on building a separate internal application for the Imaginarium platform—the Admin Dashboard. This tool was created for internal stakeholders (e.g., operations, marketing, product leadership, and support teams) to manage user accounts, analyze platform activity, and monitor high-level business metrics.
While Imaginarium’s main app serves creative users, this dashboard was designed as a back-office control center for user segmentation, organizational oversight, subscription insights, and performance reporting.
Core Features:
Admin dashboard login and role-based access
Real-time user growth and engagement analytics
Download and activity time tracking
Gender and language segmentation
Organization-based user grouping
Filtering and exportable data views
Create an intuitive admin experience with role-based access
Enable team members to quickly locate and understand user behavior
Provide visibility into platform growth and performance
Surface real-time engagement trends to support decisions
Support investor-readiness with visual, shareable reports
Conducted internal stakeholder interviews (Ops, BizDev, PMs)
Reviewed admin flows in tools like Mixpanel, Segment, and Notion analytics
Audited metrics needed for board reporting and marketing segmentation
Identified gaps in data accessibility and navigation flow
Information Architecture:
Designed the dashboard for modular expansion and logical hierarchy
Wireframing:
Low-fidelity mockups in Figma to test dashboard structure
Design System Alignment:
Used custom-built web design system with reusable chart, card, and data modules
Data Visualization:
Color-coded line graphs, bar charts, and donut charts for user clarity
Filtering and Toggles:
Built intuitive controls to segment views by timeframe, user type, and activit
100% adoption by all internal teams
Used weekly for user behavior insight and executive updates
Informed decisions for subscription segmentation, support tickets, and product metrics
Reduced manual reporting efforts by 70%
Internal tools must be just as elegant as user-facing ones to ensure adoption
Clarity, contrast, and data hierarchy are crucial in admin environments
Real-time dashboards reduce communication gaps across departments
This Admin Dashboard was not just a tool—it became the central nervous system for the entire Imaginarium organization.